
Introduction
Today, large-scale infrastructure projects—like highways, expressways, and bridges—have become extremely complex. These projects involve multiple activities running in parallel: land acquisition, design approvals, earthwork, pavement construction, drainage, safety installations, and final commissioning.
Managing all these tasks on a single timeline would be nearly impossible without a structured tool. This is where a Gantt Chart comes into play as a powerful planning and control tool.
A Gantt Chart is a visual timeline that represents all of a project’s tasks against time. This allows you to easily see when each task will start, when it will end, and which tasks depend on each other. Its importance is even greater in highway projects, where delays have a direct impact on costs and public convenience.
In this blog, we will explain in detail what a Gantt Chart is, how it works, and how to use it effectively in a highway project. We will also discuss 7 practical ways you can take your project management to the next level.
What is a Gantt chart?
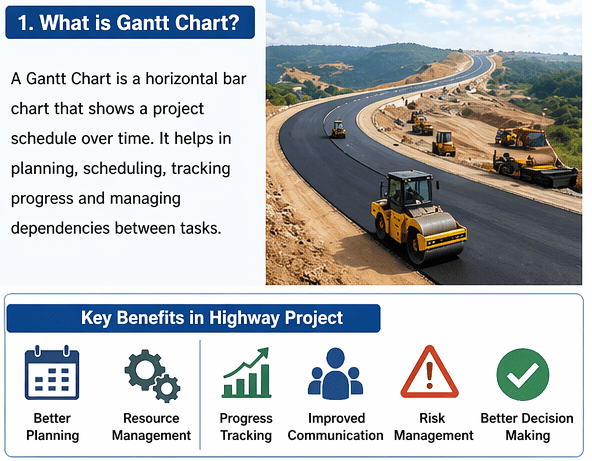
A Gantt Chart is a project management tool that displays tasks as horizontal bars on a timeline. Each task has a start date and an end date, and a bar represents its duration.
The main purpose of this chart is to clearly visualize the project schedule. When planning a highway project, you need to know which tasks you will complete first and which you will complete later. For example, you can’t start pavement work without preparing the subgrade.
A Gantt Chart clearly shows this sequence. It also shows dependencies, allowing you to understand how delaying one activity will impact other activities.
If explained in simple language, a Gantt Chart serves as a “roadmap” that guides the project from start to end.
Understanding the Structure of a Gantt Chart
A Gantt Chart has two main axes. The horizontal axis represents time—in days, weeks, or months. The vertical axis lists the project’s tasks or activities.
Each activity appears as a horizontal bar. The length of the bar indicates how long the task will take. If a task depends on another task, arrows or links connect them.
Some common activities in a highway project may include: site clearing, earthwork, embankment construction, subgrade preparation, base course, bituminous layers, drainage works, and road furniture installation.
These are logically arranged in a Gantt Chart to create a smooth workflow.
Importance of Gantt Chart in Highway Project
Highway projects are usually long-term and involve multiple stakeholders—contractors, consultants, government agencies, and suppliers.
If proper scheduling is not in place, the project can easily delay. Delays mean cost overruns and penalties. The Gantt Chart solves this problem by providing clear visibility of the entire project.
This gives the project manager clarity at every stage about where the project stands and what corrective action needs to be taken.
Weather conditions also significantly affect highway projects. Monsoon can impact some activities, such as earthwork and bituminous work. The Gantt Chart considers these factors when planning the schedule.
To know How to prepare Subgrade bed and FDD checking, Click on given Link
How to prepare the subgrade bed: complete process
FDD test: what is it? complete process and calculation.
7 Simple Ways to Use Gantt Chart
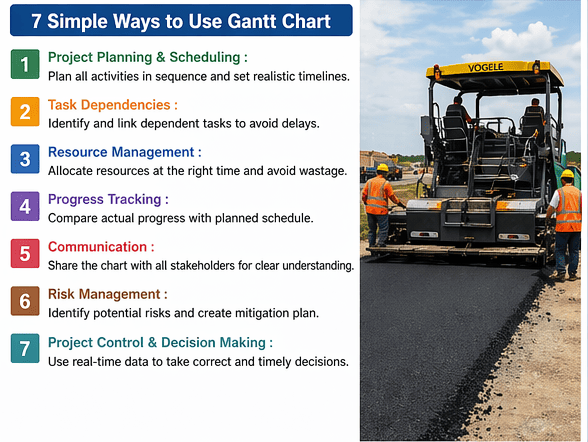
Project planning and scheduling
The most basic and important use of a Gantt Chart is in project planning. When you start a highway project, the first thing you need to do is identify all the tasks.
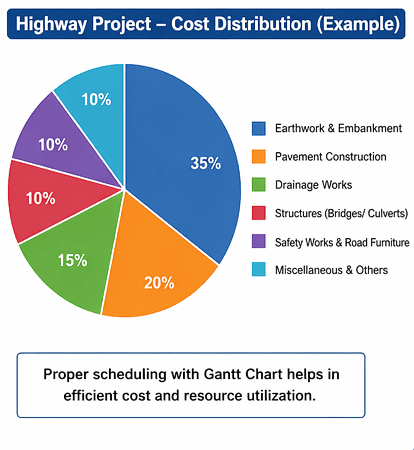
n the planning phase, you break the project into smaller activities. For example, you might divide a highway project into sections—earthwork, pavement, drainage, structures, etc.
You estimate the duration for each activity and arrange it in a logical sequence. A Gantt Chart converts this entire plan into a visual format. This gives you a clear roadmap that you can follow in the execution phase.
Understanding Task Dependencies
In highway construction, many activities depend on each other. For example, subgrade work can only begin after the embankment is complete.
It clearly show dependencies, allowing you to understand which tasks are critical and which are flexible.
Delays in a critical task can delay the entire project. Therefore, understanding and managing dependencies is crucial.
Gantt charts make this simple because you can see the entire sequence at a glance.
Resource Management
Efficient use of resources is crucial for highway projects. Resources include labor, machinery, and materials.
A Gantt chart shows you which resources you will need at which time. For example, you will need excavators and dumpers during excavation, while you will need pavers and rollers during paving.
If planning is not accurate, resources may become idle or scarce. Both situations are detrimental to the project.
It helps you optimize resource allocation.
To know better about project life cycle, Click on given Link
5 Phases of Project Life Cycle (Easy Guide)
Progress Tracking
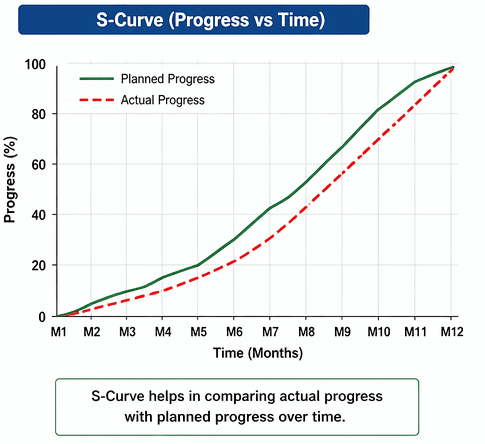
You can compare actual progress with the planned schedule. If any activity is lagging behind schedule, you can take immediate corrective action.
Daily or weekly progress monitoring is very important in highway projects. A Gantt Chart makes this process easy and visual. This gives the project manager a real-time understanding of the project’s progress.
To improve communication
Large highway projects involve multiple teams. Each team has its own role and needs to be aware of each other’s work.
A Gantt Chart provides a common communication tool. It gives all stakeholders a clear overview of the project.
Presenting a Gantt Chart during meetings can easily explain the current status of the project and the next steps. This reduces misunderstandings and improves coordination.
Risk Management
Every project has risks, and highway projects have even more risks—weather issues, material delays, labor shortages, etc. A Gantt chart allows you to identify potential risks.
If an activity is critical and at risk of delay, you can create a backup plan in advance. This can minimize project delays and improve overall efficiency.
Project control and decision making
The Gantt Chart is a powerful tool for project control. It enables the project manager to make timely decisions.
If the project deviates from schedule, it helps identify where the problem lies and what the solution might be.
Timely decision-making is crucial in highway projects because delays have a significant impact.
The Gantt Chart provides a data-driven approach that ensures accurate and effective decision-making.
Real-Life Example
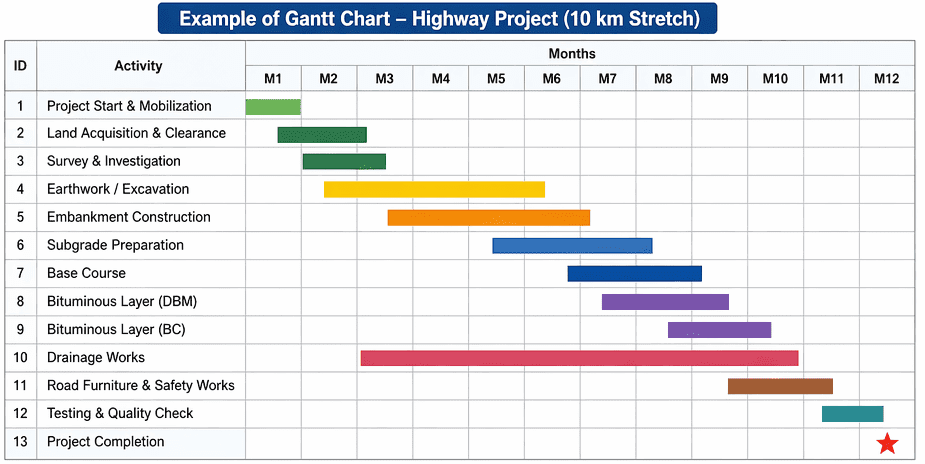
Suppose you are constructing a 10 km highway stretch.
First, you will perform land clearance and site preparation. This will be followed by earthwork and embankment construction. Then, you will work on the subgrade, base course, and bituminous layers.
If you use a Gantt Chart, you can easily plan when each task will start and when you will complete it.
If earthwork is delayed for some reason, you can immediately see the impact it will have on subsequent tasks and adjust the plan accordingly.
S curve also helps to find planned and achieved financial progress
To know better idea about Highway, Click on given Link
How to Study Typical Cross Section – Complete Guide
how to select Borrow Area: Complete Guide for Engineers
Advantages of Gantt Chart
- Gantt Charts make projects simple and understandable. It helps to make planning, scheduling, and tracking easier.
- It’s a visual tool that even non-technical stakeholders can easily understand.
- Using it on highway projects can significantly reduce delays and cost overruns.
Conclusion
In today’s landscape, infrastructure and highway projects have become significantly more complex than in the past. A single project involves managing numerous activities, resources, stakeholders, and deadlines. Without proper planning and scheduling, issues such as project delays, cost overruns, and resource mismanagement can arise. Consequently, the importance of project management tools has grown immensely.
It is a practical and powerful tool that visualizes the entire project timeline. It enables project managers and engineers to easily understand when an activity begins, its duration, and its dependencies on other tasks. It brings structure to the planning process and enhances the efficiency of project execution.
Its use is particularly crucial in highway construction projects, where various tasks—such as earthwork, subgrade preparation, pavement construction, drainage work, and the installation of road furniture—must be performed in a specific sequence. Managing these activities without proper scheduling can be challenging. This tool significantly improves progress tracking, resource allocation, communication, and risk management.
Whether you are a civil engineering student, site engineer, project planner, or project manager, understanding the Gantt Chart can prove to be a valuable skill for your career. It is not merely a tool for scheduling; it is also an effective means of controlling the project and making timely, informed decisions. When combined with proper planning and regular monitoring, its use greatly increases the likelihood of project success and helps ensure completion within the stipulated time and budget.
Here you can download the Excel sheet to get better calculation
About the Author
My name is Susanta Kumar Mohapatra. I am a civil engineering professional with over 11 years of practical experience in the construction and infrastructure sectors. I hold a B.Tech degree in Civil Engineering and an M.E. degree in Construction Management.
Throughout my career, I have worked in various areas such as road construction, bridge projects, quality control, material testing, quantity surveying, project planning, and site management. I am passionate about sharing practical knowledge related to highway engineering, laboratory testing, and construction management with engineers, students, and construction professionals.
I am the founder of CivilGuruHub.com, where I share technical articles, field experiences, laboratory test procedures, guidelines based on IRC and IS codes, and practical construction knowledge related to civil engineering. My aim is to explain civil engineering concepts in simple language and provide useful, reliable information to industry professionals.
You can connect with me through CivilGuruHub.com and my YouTube channel, “The Civil Site,” where I regularly share civil engineering tutorials and practical site knowledge.
FAQs on Gantt Chart
1. What is a Gantt Chart?
A Gantt Chart is a project management tool that displays project activities in a visual format along a timeline. It allows for an easy understanding of task start dates, end dates, and durations.
2. Who invented the Gantt Chart?
The Gantt Chart was developed around 1910 by the American engineer and management consultant Henry L. Gantt. It was named the Gantt Chart for this reason.
3. Why is a Gantt Chart used in highway projects?
Many activities occur simultaneously in highway projects. A Gantt Chart simplifies planning, scheduling, resource allocation, and progress monitoring, thereby reducing the likelihood of project delays.
4. What is the difference between a Gantt Chart and CPM?
A Gantt Chart displays the project schedule as a visual timeline, whereas CPM (Critical Path Method) identifies critical activities and the shortest path to project completion. Both tools complement each other in project management.
5. Is a Gantt Chart useful for small projects as well?
Yes, a Gantt Chart is useful not only for large projects but also for small construction projects, building works, and personal projects.
6. What is task dependency in a Gantt Chart?
Task dependency means that one activity relies on another. For instance, in highway construction, subgrade work can only begin once the embankment work is completed.
7. Which software can be used to create a Gantt Chart?
Gantt Charts can be created using software such as Microsoft Excel, Microsoft Project, Primavera P6, Smartsheet, Asana, and Trello.
8. How does a Gantt Chart help in tracking project progress?
A Gantt Chart helps compare the planned schedule with actual progress. This allows the project manager to quickly identify which activities are experiencing delays.
9. What are the main benefits of a Gantt Chart?
Its main benefits include better planning, clear scheduling, resource optimization, progress tracking, improved communication, and effective project control.
10. Why is it important for civil engineers to learn about Gantt Charts?
Civil engineers need to have knowledge of Gantt Charts for project planning, execution, and monitoring. This skill helps in successfully managing highway, bridge, and building projects.
Pingback: How to Create WBS: 8 Practical Steps Explained
Pingback: What is Time Management? 10 Proven Project Management Tips