
Introduction
Soil testing constitutes a vital component of geotechnical engineering and highway construction. The strength and stability of any road, building, embankment, dam, or pavement structure depend directly on the properties of the soil.
If the engineering properties of the soil are not properly understood, problems such as settlement, cracking, rutting, slope failure, and pavement distress may manifest in the future. For this reason, various types of tests take place in soil testing laboratories, among which the Atterberg Limits test is considered one of the most fundamental and critical.
Atterberg Limits determine the consistency behavior of soil. This test helps ascertain whether, at a specific moisture content, the soil will behave as a solid, a semi-solid, a plastic material, or a liquid.
Fine-grained soils such as clay and silt and their behavior when they come into contact with water. To scientifically characterize this behavior, the Liquid Limit (LL), Plastic Limit (PL), and Plasticity Index (PI) are determined.
The Swedish scientist Albert Atterberg originally introduced the concept of Atterberg Limits, and Casagrande subsequently developed it into a modern laboratory testing method.
Today, this test extensively aids highway engineering, foundation engineering, embankment construction, earth dam projects, and soil stabilization works.
According to Indian Standards, this test conforms to IS 2720 Part 5. In highway projects, MoRTH specifications and IRC guidelines also define soil plasticity limits to ensure the sustained performance of the pavement structure.
In this detailed blog post, we will explore the complete concept of Atterberg Limits—including the laboratory procedure, required equipment, calculations, graphical representations, IS code limits, and practical applications—explained in simple, easy-to-understand language.
What are Atterberg Limits?
Atterberg Limits define the consistency of soil by establishing moisture content limits. When fine-grained soil receives water, the soil’s behavior undergoes continuous changes. At a certain moisture content, the soil feels hard and brittle; at another stage, it becomes moldable; and with excessive water, it transitions into a flowing state.
Atterberg Limits essentially identify the specific moisture contents at which the soil changes its state. These limits consist primarily of three types:
- Liquid Limit (LL)
- Plastic Limit (PL)
- Plasticity Index (PI)
The Liquid Limit represents the moisture content at which the soil transitions from a plastic state to a liquid state.
The Plastic Limit represents the moisture content at which the soil converts from a semi-solid state to a plastic state.
And The Plasticity Index indicates the plastic range of the soil and equals the difference between the LL and the PL.
Importance of Atterberg Limits
Atterberg Limits play a crucial role in determining soil classification and engineering behavior. If a soil exhibits a high Liquid Limit, it indicates a high clay content within the soil, implying a correspondingly high tendency for swelling and shrinkage. Similarly, soils with a high Plasticity Index undergo greater deformation under the influence of water.
In road construction, the Liquid Limit (LL) and Plasticity Index (PI) values of the subgrade soil must fall within a limited, specified range. If the PI value is excessive, the risk of pavement settlement and cracking increases.
States of Soil Consistency
Fine-grained soil exists in different states depending on its moisture content. Understanding these states is essential for comprehending the concept of Atterberg Limits.
| Soil State | Description |
|---|---|
| Solid State | Soil becomes hard and brittle |
| Semi-Solid State | Slight deformation is possible |
| Plastic State | Soil becomes moldable and retains its shape |
| Liquid State | Soil starts flowing like a liquid |
When the moisture content continuously increases, the soil transitions from the solid state to the liquid state.
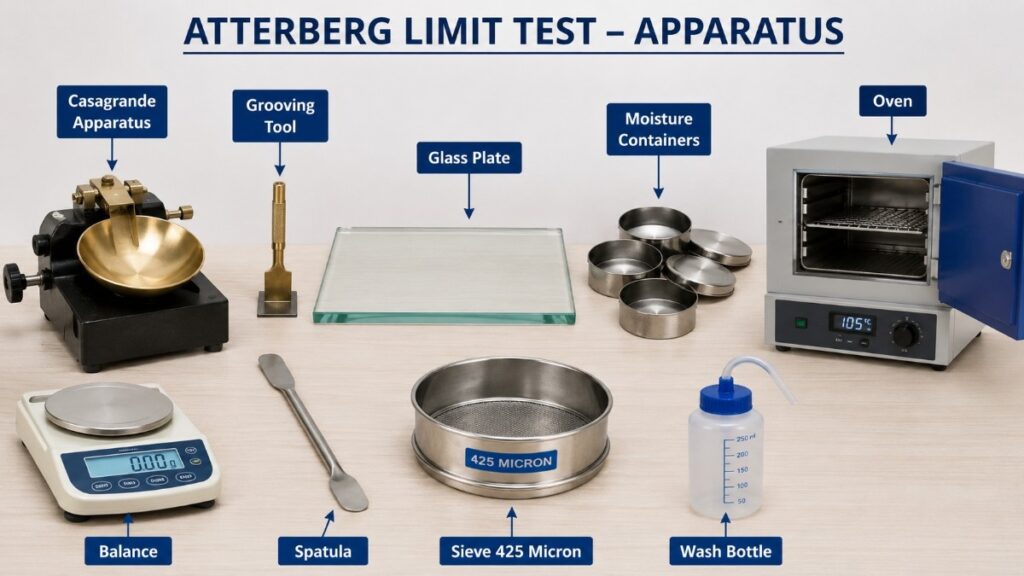
Equipment Required for Atterberg Limits Test by cassagranda apparatus
To perform the Atterberg Limits test, certain standard equipment is used in the laboratory. The proper selection of equipment is crucial for obtaining accurate results.
| Equipment Name | Purpose |
|---|---|
| Casagrande Apparatus | Used for determining the Liquid Limit of soil |
| Grooving Tool | Used for creating a standard groove in the soil sample |
| Glass Plate | Used for rolling soil threads during the Plastic Limit test |
| Moisture Containers | Used for measuring moisture content of soil samples |
| Oven | Used for drying soil samples at standard temperature |
| Balance | Used for accurate weight measurement of soil samples |
| Spatula | Used for mixing and handling soil samples |
| 425 Micron Sieve | Used for separating fine-grained soil particles |
| Wash Bottle | Used for adding water to the soil sample during mixing |
The Casagrande apparatus features a brass cup that is repeatedly dropped, and the closure of the groove is observed.
Easy Procedure in 9 Simple Steps for Atterberg Limits test
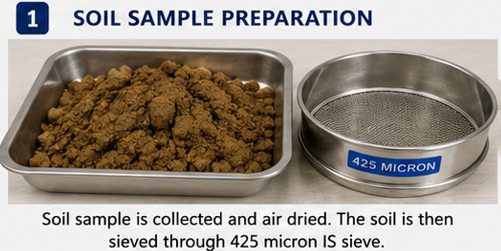
Step 1 – Soil Sample Collection and Preparation (Atterberg Limits Test)
The first and most crucial step in the Atterberg Limits test is the collection of the soil sample. If the sample is not representative, the laboratory results will not be accurate. Generally, a worker collects a disturbed soil sample from the field and spreads it out in the laboratory for air drying.
The technician gently pulverizes the dry soil to break down any lumps. Care must be taken to avoid using excessive force, as this could alter the natural properties of the soil particles. The laboratory staff then passes the prepared soil through a 425-micron IS sieve; only the material passing through the sieve is used for the test.
During sample preparation, it is essential for the technician to remove organic matter, roots, and gravel. If the technician does not properly prepare the sample, the observed groove closure behavior and rolling characteristics may be inaccurate.
Laboratory engineers typically prepare a sufficient quantity of soil to facilitate the easy conduct of multiple trials. The technician should add moisture gradually, and it is crucial to mix the soil-water mixture uniformly.
This step is extremely critical, as the accuracy of the entire test depends upon it.
According to the IS code, approximately 120 g of soil is required for the LL test, and around 20 g for the PL test.
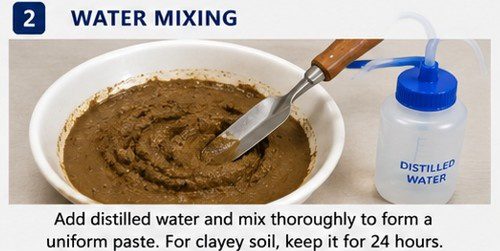
Step 2 – Preparation of Soil Paste for Liquid Limit Test (Atterberg Limits Test)
To perform the Liquid Limit test, a soil paste is prepared. Distilled water is gradually added to the soil sample while continuously mixing it with the aid of a spatula. The objective is to create a homogeneous paste that is free from any dry pockets.
The soil paste should be neither too dry nor too wet. If the paste is excessively wet, the groove will close immediately, making it impossible to observe an accurate blow count. Conversely, if the mixture is too dry, it will require an excessive number of blows for the groove to close.
The properly mixed soil may also be allowed to rest for a period of time to facilitate moisture equilibration. Resting is particularly beneficial for clayey soils to ensure uniform moisture distribution.
The engineer must ensure that the consistency of the sample is workable and that it can be easily placed into the Casagrande cup. The mixing process should be smooth and free of lumps.
This stage establishes the foundation for determining the Liquid Limit and is crucial for obtaining accurate results.
For clayey soils, it is recommended to store the soil in an airtight container for approximately 24 hours to ensure uniform moisture distribution.
At this stage, the consistency of the soil should be smooth and homogeneous.
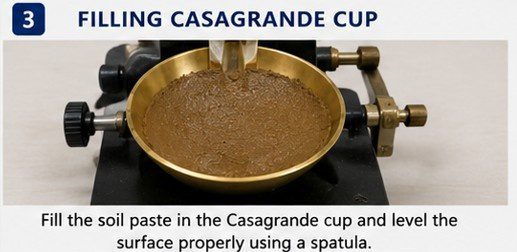
Step 3 – Placement of Soil in Casagrande Device (Atterberg Limits Test)
The prepared soil paste is carefully placed into the Casagrande brass cup. The soil is spread uniformly to ensure that an even thickness is maintained within the cup.
It is important to eliminate excess air voids, as trapped air can affect the groove closure behavior. The soil surface is given a smooth finish using a spatula.
The maximum thickness of the soil placed in the cup is maintained at approximately 10 mm. Surface leveling is crucial to ensure that the groove can be prepared to standard dimensions.
The Casagrande apparatus must be properly adjusted. The cup drop height is maintained in accordance with standard specifications.
In laboratory practice, the apparatus is calibrated regularly, as worn-out components can yield incorrect blow counts.
This step directly influences the repeatability and accuracy of the test.
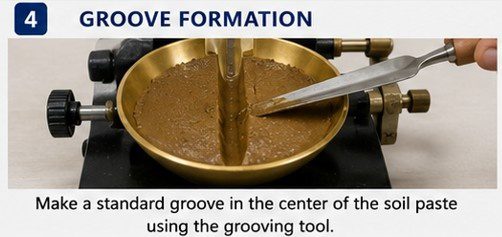
Step 4 – Groove Formation and Blow Counting (Atterberg Limits Test)
With the aid of a grooving tool, a standard groove is cut into the center of the soil sample. The dimensions of the groove must conform to IS specifications.
The Casagrande handle is rotated, causing the brass cup to drop repeatedly onto a hard rubber base. Each rotation constitutes one blow.
The engineer observes and records the number of blows required for the bottom of the groove to close over a length of approximately 12 mm. Typically, multiple trials are conducted using soil samples with varying moisture contents.
Accurate counting of blows is crucial; excessive rotation speed or jerky movements can lead to erroneous results. A standard speed of approximately 2 revolutions per second is maintained.
Readings falling within the range of 15 to 35 blows are typically recorded to facilitate the plotting of an accurate flow curve.
Following each trial, a soil sample is collected from the area where the groove closed to determine its moisture content.
This step constitutes the core operation of the Liquid Limit test.
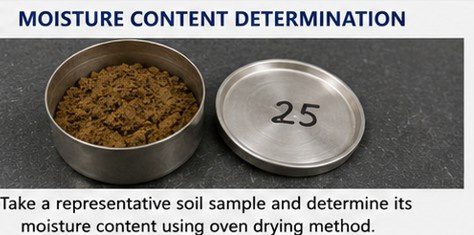
Step 5 – Moisture Content Determination for Liquid Limit (Atterberg Limits Test)
A representative soil sample is collected in moisture cans from the groove closure area. The wet weight is measured immediately to prevent any loss of moisture.
The sample is dried in an oven at a temperature of 105 to 110 degrees Celsius for approximately 24 hours. After drying, the dry weight is measured.
The water content is calculated using the moisture content formula.
Moisture Content Formula:
w = [(W1 – W2) / W2] × 100
Where,
W1 = Wet weight of soil
W2 = Dry weight of soil
Each blow count is recorded along with its corresponding moisture content. Multiple observations are used to prepare a flow curve.
Accurate weighing and proper oven drying are essential for obtaining reliable results.
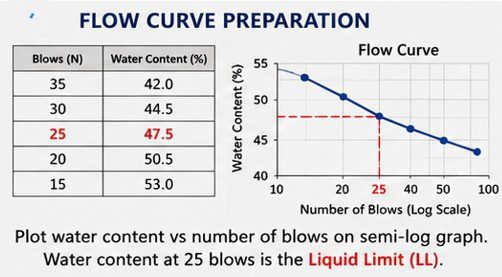
Step 6 – Plotting Flow Curve and Determination of Liquid Limit (Atterberg Limits Test)
A semi-log graph is plotted to determine the Liquid Limit in Casagrande grooving tools method. The number of blows is plotted on the X-axis using a logarithmic scale, while the moisture content is plotted on the Y-axis using a normal scale.
By marking the various observations on the graph, a best-fit straight line is drawn. Using this flow curve, the moisture content corresponding to 25 blows is determined. This specific value constitutes the Liquid Limit.
The preparation of the graph is of paramount importance, as the final Liquid Limit value is derived directly from it.
Sample Observation Table for Liquid Limit
| Trial No | Number of Blows | Moisture Content (%) |
| 1 | 15 | 53 |
| 2 | 20 | 50.5 |
| 3 | 25 | 47.5 |
| 4 | 30 | 44.5 |
| 5 | 35 | 52.0 |
Graph Requirement
The graph should maintain a smooth, straight trend. If the readings appear irregular, a retest is performed.
The flow curve represents the soil’s consistency behavior and plays a significant role in geotechnical interpretation.
To get more Blogs Regarding Quality control tests, Click on Given links
how to perform Proctor Test: 10 Easy Steps (Complete Guide)
7 Major Types of Soil: A Complete Guide step-by-step
what is Juran’s Trilogy of Quality : Explained Simply
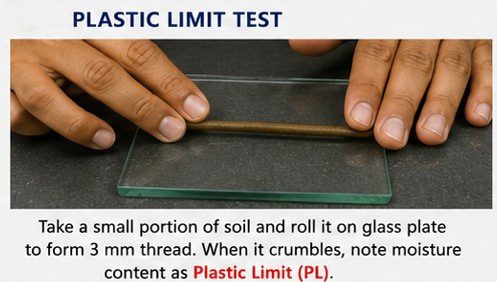
Step 7 – Plastic Limit Test Procedure (Atterberg Limits Test)
A small portion of the soil sample of 20 gm is taken, and hand rolling is performed on a glass plate.
The soil thread is gradually rolled until its diameter reaches approximately 3 mm. If the thread begins to crumble at a diameter of 3 mm, that specific moisture content is considered the Plastic Limit.
It is crucial to perform the rolling process using smooth and uniform pressure. Excessive pressure can lead to inaccurate results.
The crumbled soil is collected in a moisture container to determine its water content.
The Plastic Limit serves as an indicator of the soil’s moldability and workability. High Plastic Limit values are generally observed in clayey soils.
Multiple trials are conducted, and the average value is reported as the final Plastic Limit.
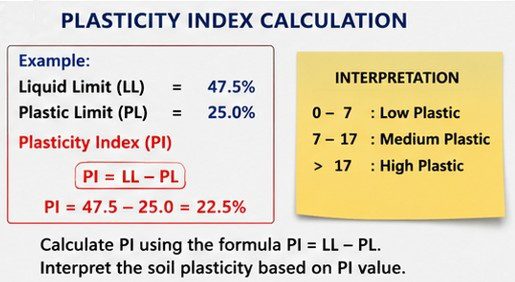
Step 8 – Calculation of Plasticity Index (Atterberg Limits Test)
The Plasticity Index indicates the plastic range of a soil. It is simply equal to the difference between the Liquid Limit and the Plastic Limit.
Formula:
PI = LL – PL
Example:
Liquid Limit = 45%
Plastic Limit = 25%
PI = 45 – 25 = 20%
Soils with a high PI are generally highly compressible and expansive in nature. Soils with a low PI exhibit comparatively stable behavior.
The Plasticity Index is considered a very important parameter in highway engineering because an excessive PI can lead to subgrade problems.
With the help of the PI, decisions regarding soil classification and stabilization can be made with ease.
Step 9 – Interpretation of Results According to IS Code and MoRTH (Atterberg Limits Test)
In the final stage, the obtained values are evaluated in accordance with this classification and the MORTH specifications.
Soil Classification According to Plasticity Index
| PI Value | Soil Classification |
|---|---|
| 0 – 5 | Non-Plastic to Low Plastic Soil |
| 5 – 10 | Medium Plastic Soil |
| 10 – 20 | Plastic Soil |
| Greater than 20 | Highly Plastic Soil |
Typical Liquid Limit Classification
| Liquid Limit (%) | Soil Compressibility |
|---|---|
| Less than 35 | Low Compressibility |
| 35 – 50 | Medium Compressibility |
| Greater than 50 | High Compressibility |
MoRTH Recommended Limits for Embankment and Subgrade Soil
| Property | Recommended Limit |
|---|---|
| Liquid Limit | Maximum 50% |
| Plasticity Index | Maximum 25% |
In highway projects, soils with generally lower Plasticity Index (PI) and moderate Liquid Limit (LL) are preferred due to their superior stability and compaction behavior.
The interpretation stage constitutes the most critical part of engineering decision-making.
Common Errors During Atterberg Limits Test
Certain common mistakes in laboratory testing can significantly affect the results.
- Improper sample preparation is a major source of error. If the soil is not properly pulverized, a representative consistency cannot be achieved.
- Incorrect calibration of the Casagrande apparatus may produce inaccurate blow counts.
- Excessive groove cutting or improper rolling pressure also affects Plastic Limit results.
- Moisture loss during weighing is another common issue; for this reason, it is essential to record the wet weight immediately.
- Engineers should adhere to proper laboratory practices to ensure that reliable and repeatable results are obtained.
Applications of Atterberg Limits Test
The Atterberg Limits test is utilized in almost every geotechnical project.
- In road construction, it is used to evaluate the suitability of the subgrade. Highly plastic soils generally lead to pavement failures.
- In foundation engineering, the Liquid Limit (LL) and Plasticity Index (PI) serve as crucial parameters for identifying expansive clays.
- This test is also useful in the construction of earth dams for assessing moisture sensitivity and workability.
- In soil stabilization projects, the requirement for lime or cement can be indirectly estimated based on the soil’s plasticity behavior.
- An understanding of soil consistency is also essential in projects related to agricultural and environmental engineering.
Advantages of Atterberg Limits Test
- This test is relatively simple and economical. The laboratory setup is also comparatively easy.
- The test results provide valuable information regarding soil behavior.
- It is extensively used in classification and pavement design decisions.
- It makes it possible to evaluate moisture sensitivity and shrink-swell potential.
- Due to the existence of a standardized IS procedure, repeatability and comparability are maintained.
Limitations of Atterberg Limits Test
- This test is primarily suitable for fine-grained soils. Its significance is limited in coarse-grained soils.
- Operator skill can affect results, especially in the Plastic Limit rolling process.
- Interpretation may be difficult in organic soils and soils with unusual mineralogy.
- The test indirectly indicates behavior; actual field performance depends on multiple factors.
To get more Blogs Regarding Quality control tests, Click on Given links
Types of Cement in Civil Engineering: A Complete Guide
FDD test: what is it? complete process and calculation.
how to select Borrow Area: Complete Guide for Engineers
Conclusion
The Atterberg Limits test is a fundamental and highly significant laboratory test in soil engineering. With the aid of this test, engineers are able to understand soil consistency and moisture sensitivity. The Liquid Limit, Plastic Limit, and Plasticity Index play a crucial role in soil classification, pavement design, embankment construction, and foundation engineering.
By adhering to the standard procedures outlined in IS 2720 Part 5, reliable and accurate results can be obtained. In highway projects, it is essential to maintain permissible limits in accordance with MoRTH specifications to ensure long-term pavement performance.
A proper interpretation of Atterberg Limits assists engineers in predicting future soil behavior. For this reason, this test remains an integral part of routine quality control and design investigations in geotechnical laboratories.
If the laboratory procedures are followed meticulously and the graphs and calculations are prepared accurately, the results obtained from the Atterberg Limits test prove highly valuable in making sound engineering decisions.
To get excel format click below.
About Author
My name is Susanta Kumar Mohapatra. I am a civil engineering professional with over 11 years of practical experience in the construction and infrastructure sectors. I hold a B.Tech degree in Civil Engineering and an M.E. degree in Construction Management.
Throughout my career, I have worked in various areas such as road construction, bridge projects, quality control, material testing, quantity surveying, project planning, and site management. I am passionate about sharing practical knowledge related to highway engineering, laboratory testing, and construction management with engineers, students, and construction professionals.
I am the founder of CivilGuruHub.com, where I share technical articles, field experiences, laboratory test procedures, guidelines based on IRC and IS codes, and practical construction knowledge related to civil engineering. My aim is to explain civil engineering concepts in simple language and provide useful, reliable information to industry professionals.
You can connect with me through CivilGuruHub.com and my YouTube channel, “The Civil Site,” where I regularly share civil engineering tutorials and practical site knowledge.
Frequently Asked Questions (FAQs)
1. What is the Atterberg Limits test?
The Atterberg Limits test is a laboratory test used to determine the consistency and plasticity of fine-grained soils.
2. What does the Liquid Limit indicate?
The Liquid Limit is the moisture content at which a soil transitions from a plastic state to a liquid state.
3. What is the formula for the Plasticity Index?
PI = LL – PL
4. Which IS code is used for the Atterberg Limits test?
IS 2720 Part 5 is commonly used.
5. Why is the PI important in highway engineering?
Soils with a high PI can lead to problems such as swelling and pavement failure.
6. What is the thread diameter in the Plastic Limit test?
A diameter of approximately 3 mm is maintained.
7. How is the Liquid Limit graph prepared?
A flow curve is plotted based on the moisture content and the logarithm of the number of blows.
8. Where are Atterberg Limits applied?
They are used in projects involving roads, foundations, embankments, and soil stabilization.
9. In which test is the Casagrande apparatus used?
It is used for the determination of the Liquid Limit.